1n4NO
All work

PolInsight India

State-level analytics for election campaign teams.

Next.jsReactTypeScriptD3.jsData Visualization

Project brief

The product bet, in plain language.

Made dense election data easier to scan with KPI tiles, drill-down maps, hover states, and constituency context.

Hiring signal

Senior ownership across product framing, scope, and shipped interface quality.

Engineering detail

Focus on constraints, architecture choices, external systems, and data flow.

Role
Dashboard architecture, data visualization, interaction design, and analytics UI implementation
Scope
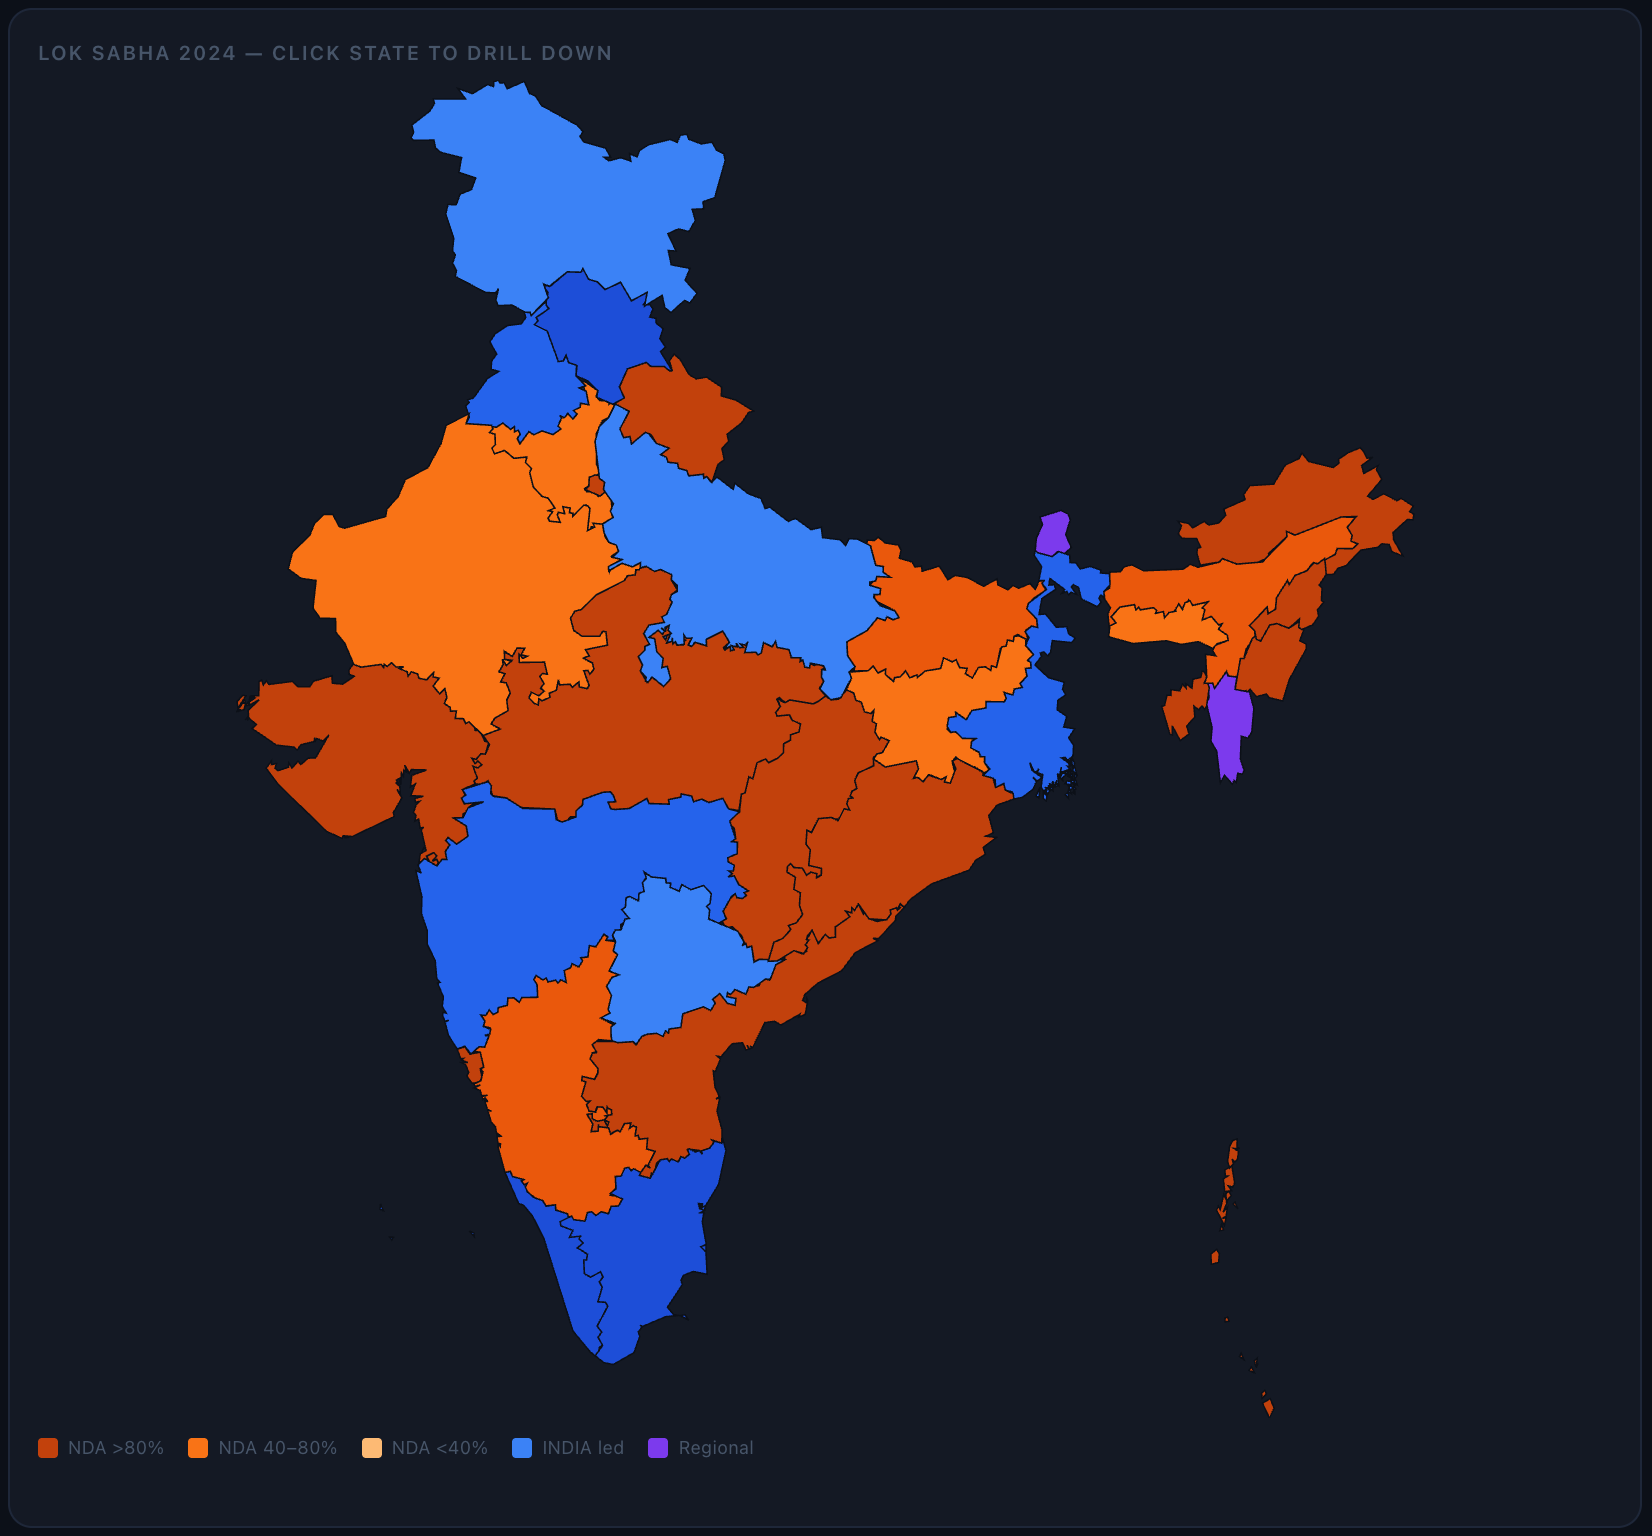
National KPIs, India map drill-down, state and constituency views, trend widgets, and intelligence panels
Core constraint
The interface had to preserve data density without overwhelming campaign users during fast analysis.
Technical bet
Progressive disclosure through map and widget interactions would work better than a flat dashboard grid.
Drag to scrub
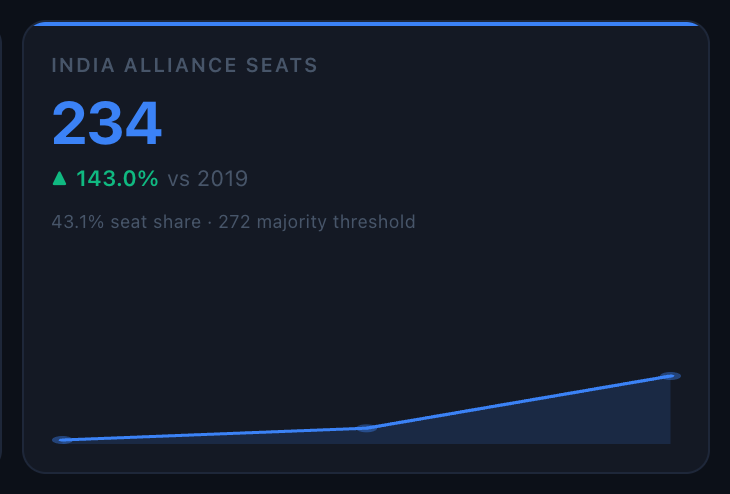
Dark mode KPI tile showing INDIA alliance seats
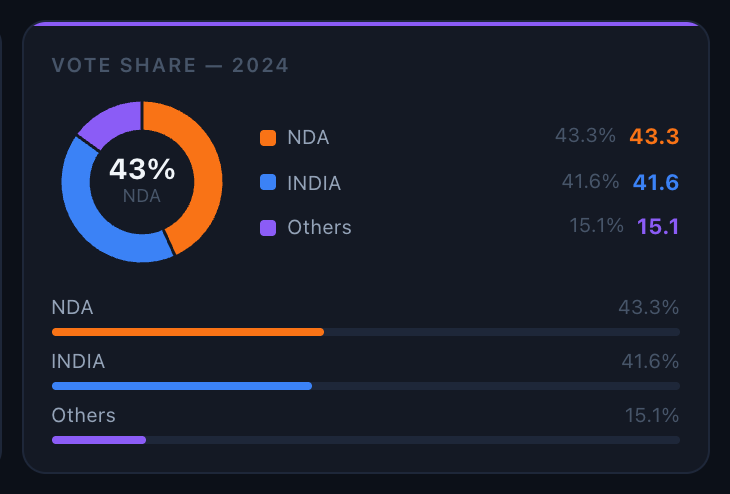
Dark mode KPI tile showing vote share breakdown
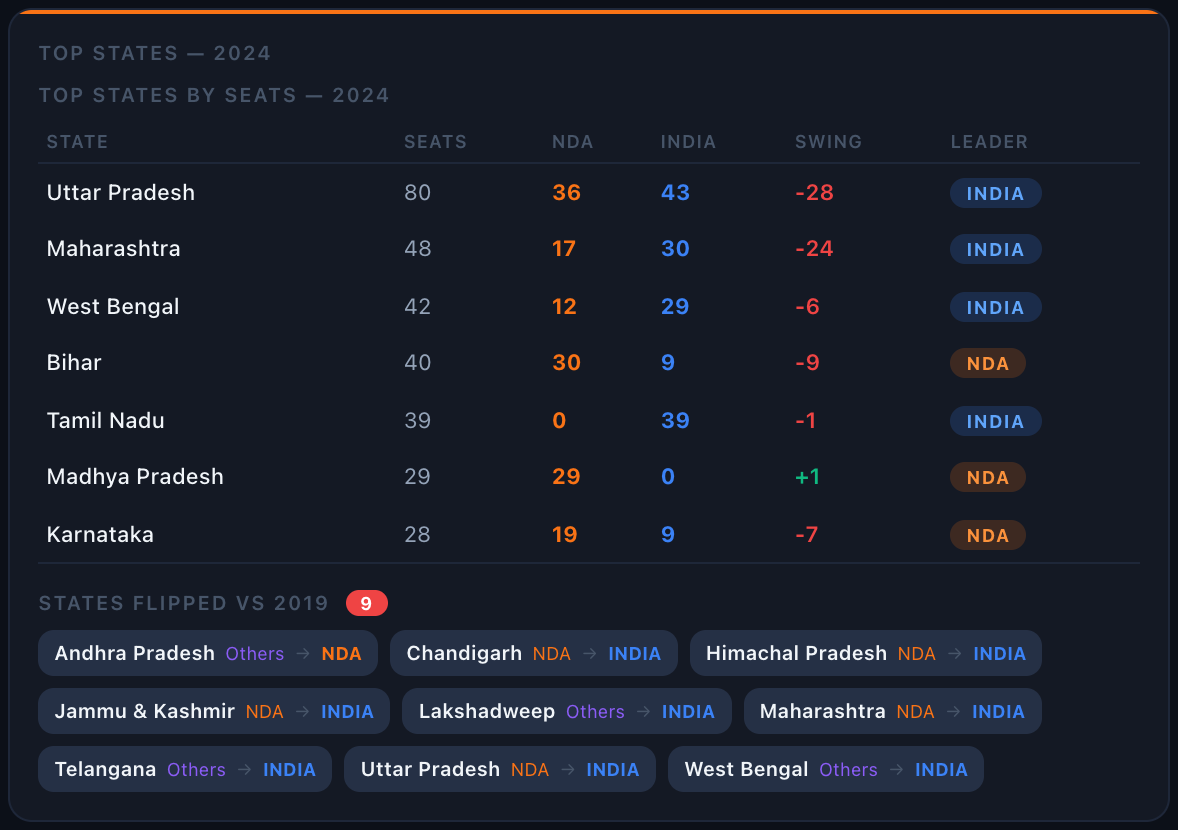
Dark mode Top States widget with seat totals and flipped states
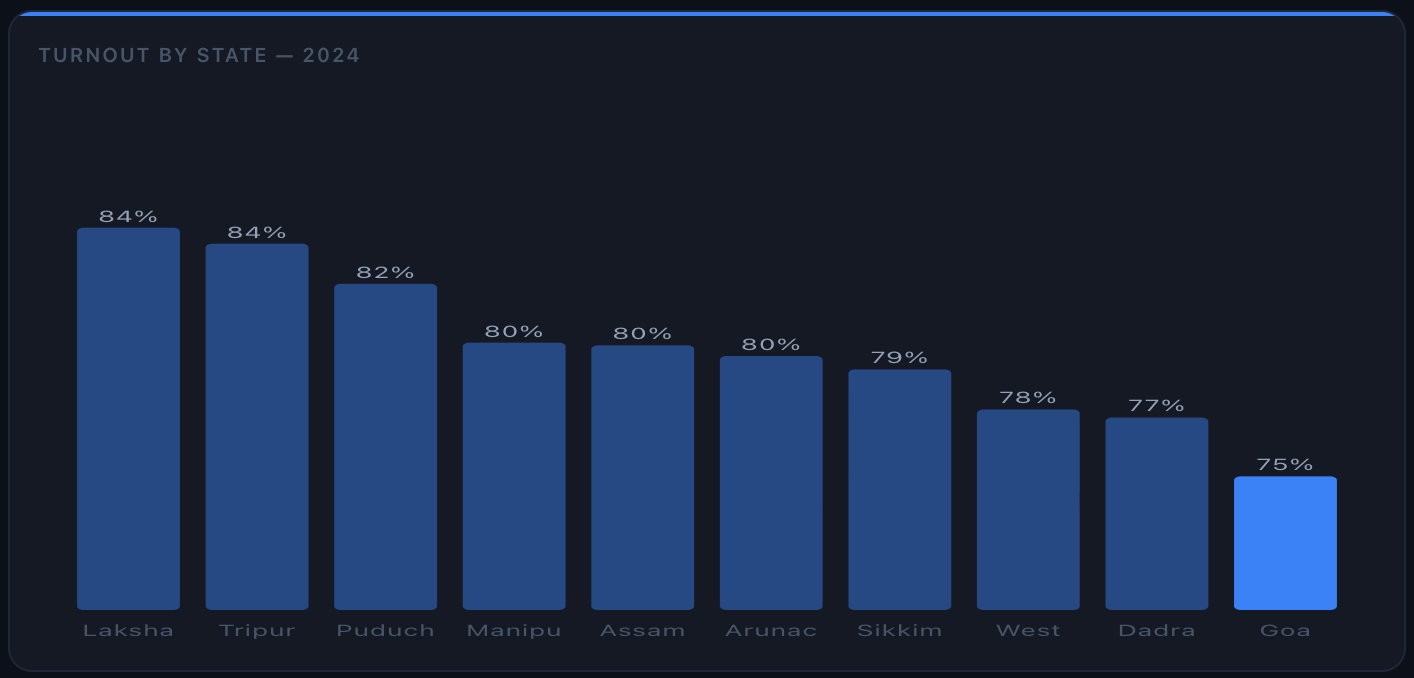
Dark mode turnout by state widget
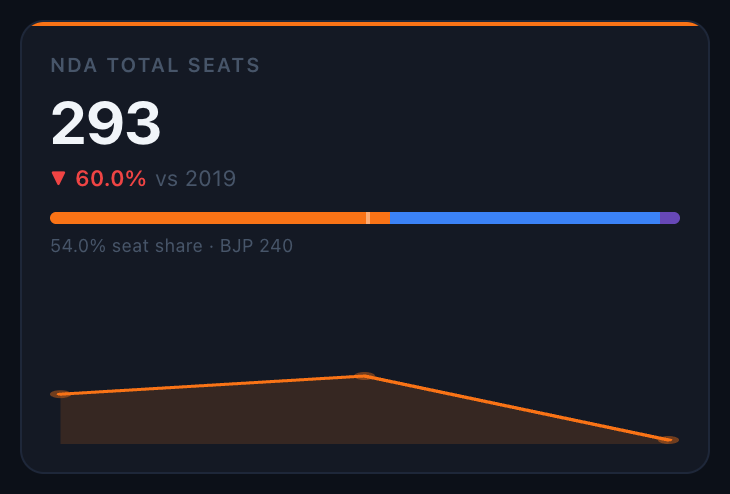
Dark mode KPI tile showing NDA total seats
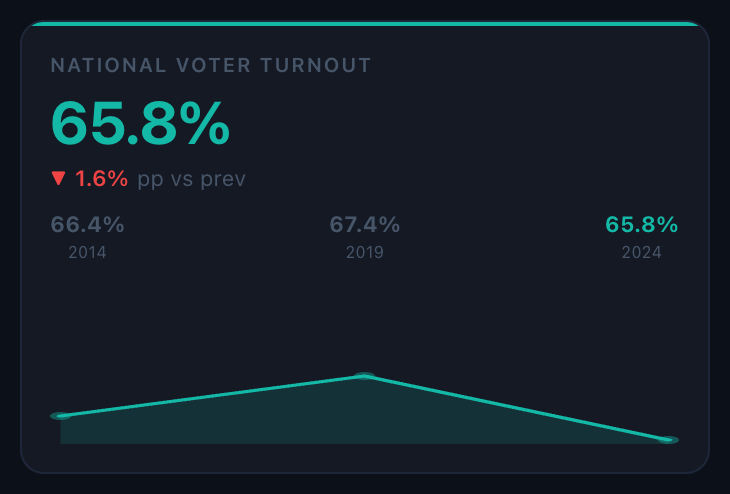
Dark mode KPI tile showing national voter turnout
Dark mode India map widget for national election drill-down
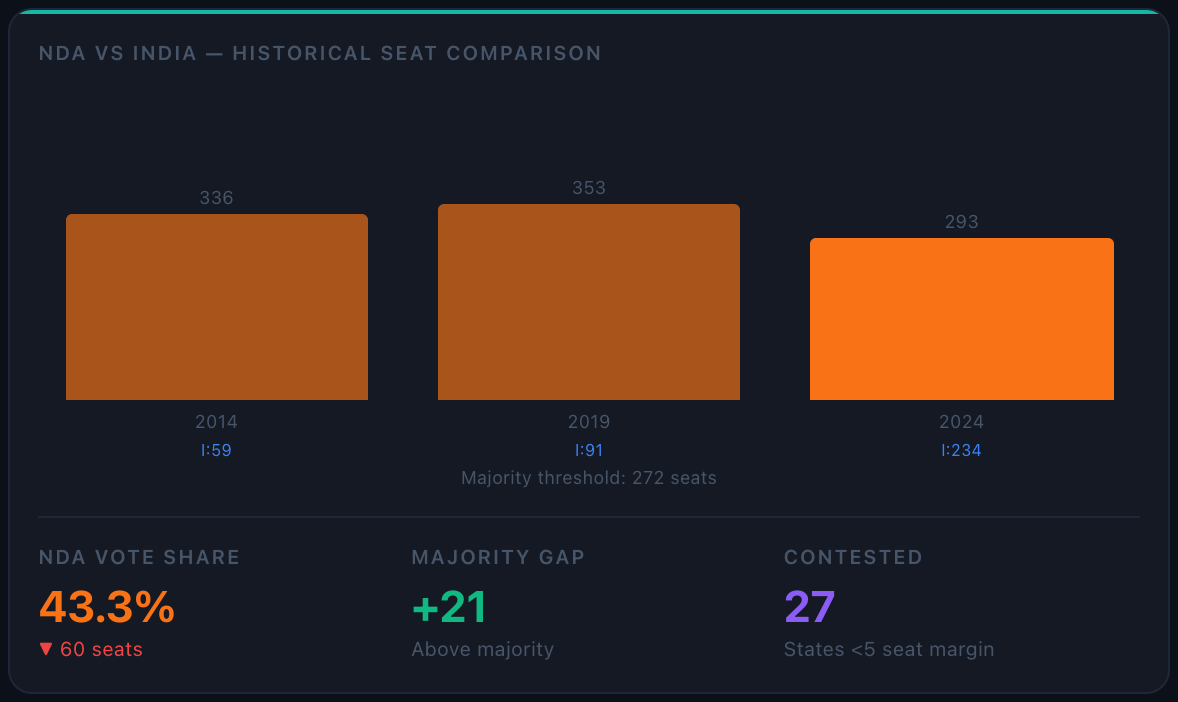
Dark mode historical seat comparison widget
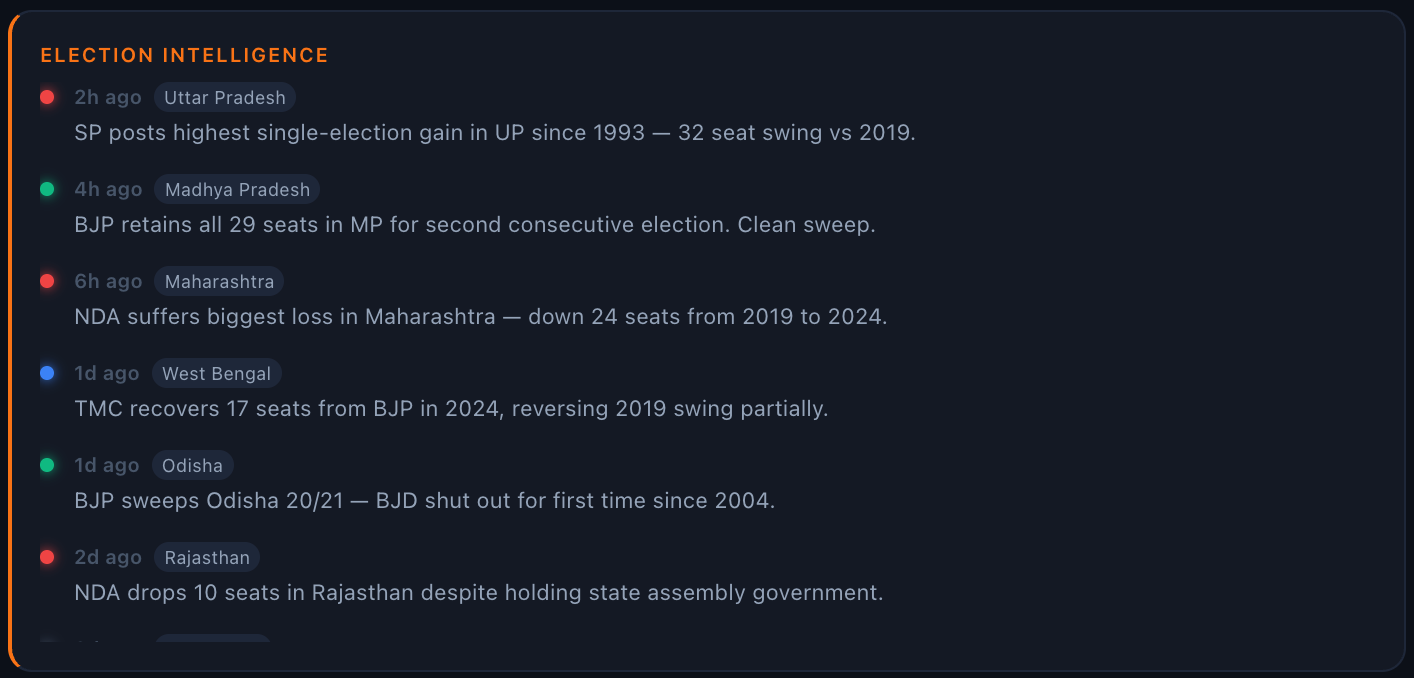
Dark mode election intelligence widget

Overview

A state-level analytics dashboard built for campaign teams working with dense regional data under compliance constraints, surfacing the numbers that matter without burying the reader in them.

Problem

Campaign and civic data is naturally hierarchical — state, region, constituency — and most dashboards either flatten it into one overwhelming view or force a slow drill-down for every question.

Approach

I focused the frontend architecture on progressive disclosure: a state-level overview that stays legible at a glance, with drill-down views that load only the data the viewer has actually asked for, kept fast and standards-compliant throughout.

Project method

Detailed process

Requirements

The dashboard needed to make dense election data scannable for campaign teams: national view, state drill-down, constituency detail, turnout, vote share, alliance splits, and trend context across election years. The key requirement was speed of interpretation, not just chart coverage.

Stack choices

Vite and React kept the dashboard fast and client-focused, TypeScript protected the regional data model, Zustand handled navigation and selection state, TanStack Query was available for data workflows, and D3 powered the custom map and charting needs that generic dashboard components would not cover well.

Design system

The interface moved toward an atomic structure with atoms such as StatNumber, ProgressBar, Sparkline, Badge, and ChartTooltip; molecules such as MetricCard and PartyBreakdown; and organisms such as StateMap and historical charts. Design tokens such as bg-base, bg-header, bg-surface, border, text-primary, text-muted, nda, india, others, and info kept the analytics UI consistent.

MVP definition

The MVP was an India-to-state drill-down with year switching for 2014, 2019, and 2024, KPI cards, alliance comparison, map interaction, and constituency-level panels. Authentication, advanced filtering, and broader campaign tooling were secondary to proving the core exploration flow.

Progression

The project progressed from normalized election data and hash-based navigation into bento-style dashboard composition. Once the state selection model worked, maps, trend sparklines, vote-share donuts, and constituency panels were layered in to support progressively deeper analysis without forcing full page transitions.
Takeaway

Solution

A dashboard that scales from a statewide summary down to constituency-level detail without a full page reload, with accessibility and data accuracy treated as first-class requirements.

Evidence

Highlights

03 signals
  • 01Hierarchical drill-down from state to constituency level
  • 02Performance-conscious rendering of dense regional datasets
  • 03Built to standards-compliance requirements from day one

Screenshots

Open channel

Need a sharper frontend path?

Architecture, AI workflows, design systems, and interfaces that need to hold up after launch.